
Goal: Convert casual users of the service into paying members
Source: primary data, 12 datasets containing data for 2022
Context:
You are a junior data analyst working in the marketing analyst team at Cyclistic, a bike-share company in Chicago. The marketing director believes the company’s future success depends on maximizing the number of annual memberships. Therefore, your team wants to understand how casual riders and annual members use Cyclistic bikes differently. From these insights, your team will design a new marketing strategy to convert casual riders into yearly members.
Data merging:

Data validation and exploration:


Data cleaning and extraction:

Data analysis and visualization using Tableau:
I started by analyzing the percentage of members and casual riders in the dataset.
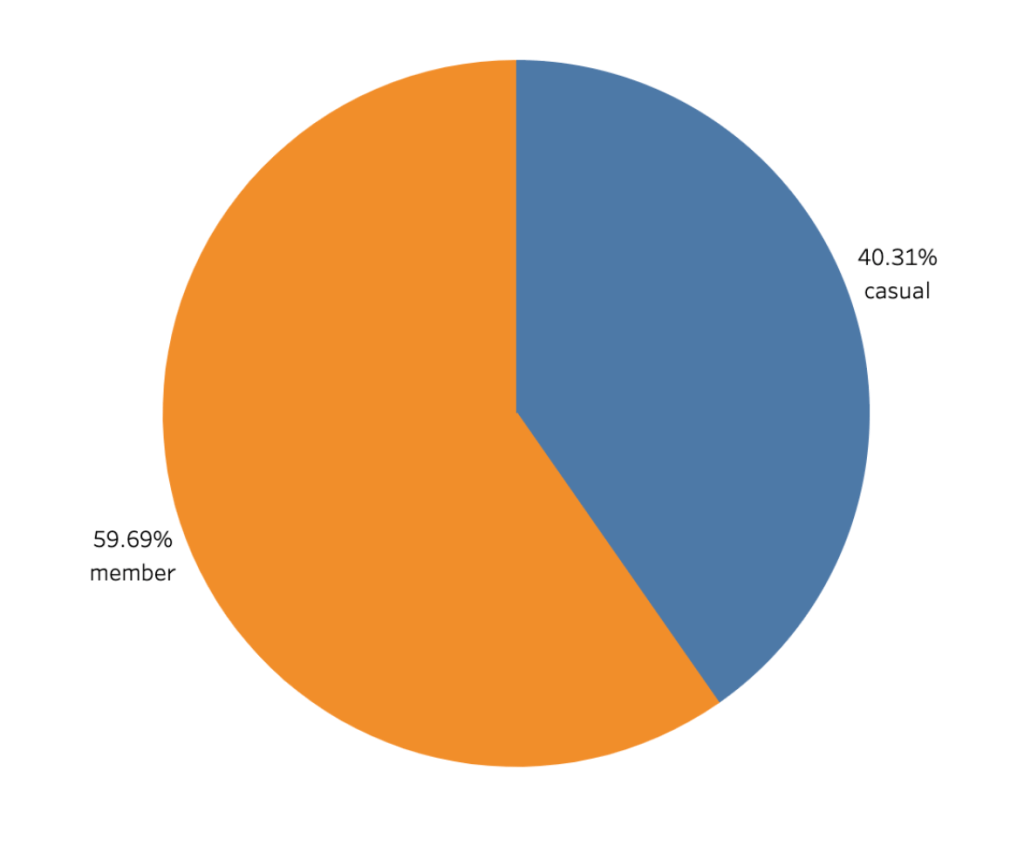
We have a good percentage of casual users we can try to convert into members.
Then, let’s see if there are differences in service usage between members and casual users. We might leverage these differences to our advantage.
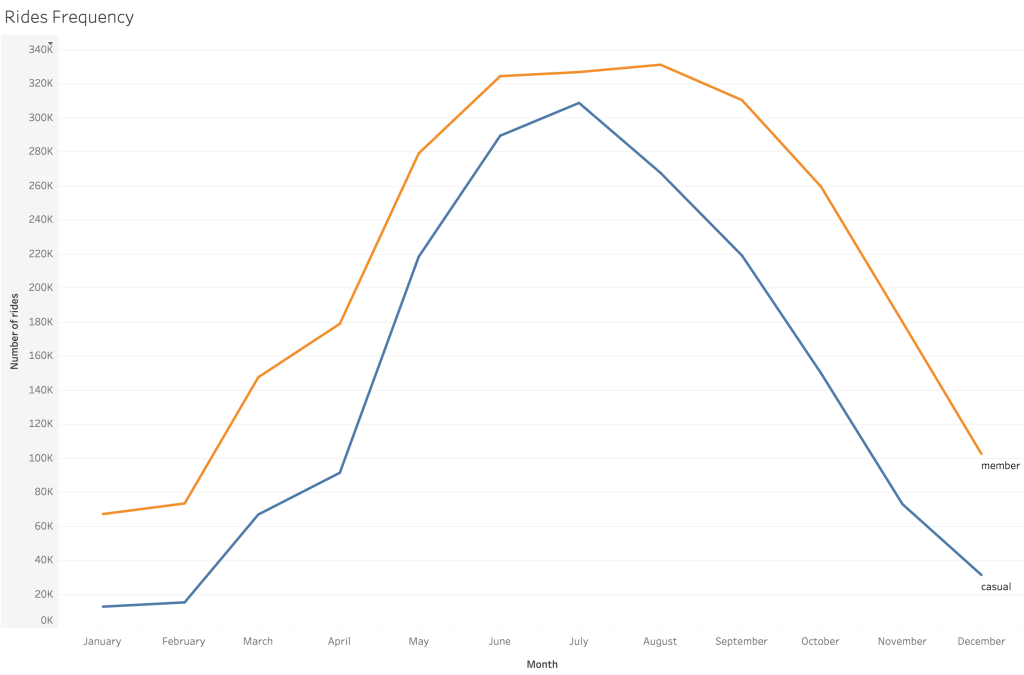
Members tend to take more rides on average.
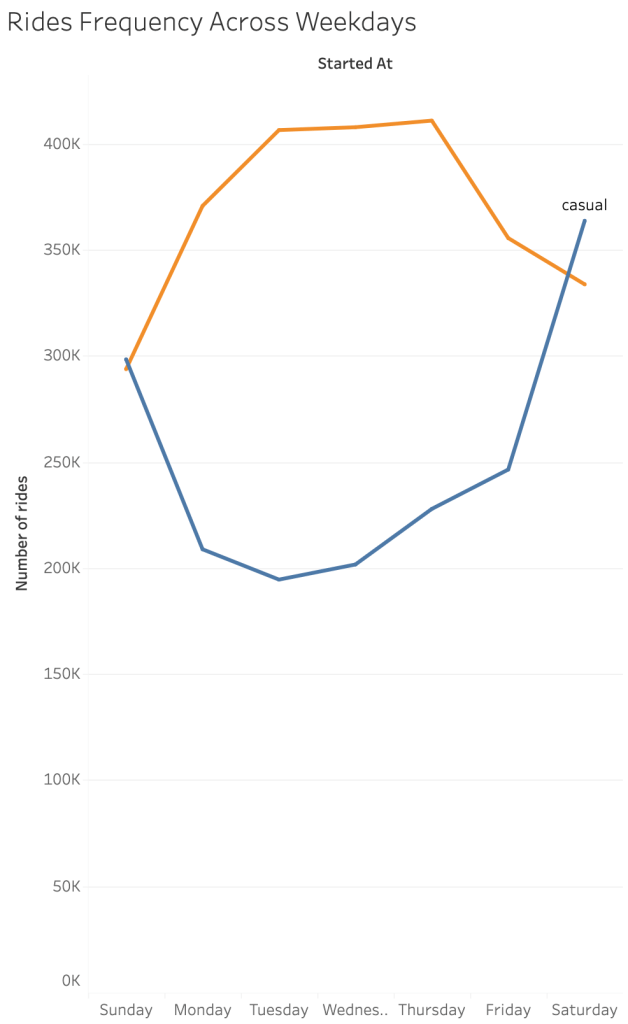
We’ve already found a fascinating insight in our data. The trend over the week is the opposite. Members take more rides on weekdays, while casual users take more rides on weekends.
Hypothesis: members use the bike mainly for commutes, while casual users use it for occasional needs
If the hypothesis is accurate, it can mean that the service subscription is seen as more advantageous for commuting and less valid for occasional rides.
Commutes should be shorter than occasional rides since long commutes usually require a car or public transportation. On the other hand, occasional rides can be longer and take more time.
Let’s explore the difference of rides average duration in 2022:

Casual users tend to take longer rides compared to members.
Let’s see how ride durations change throughout the week:
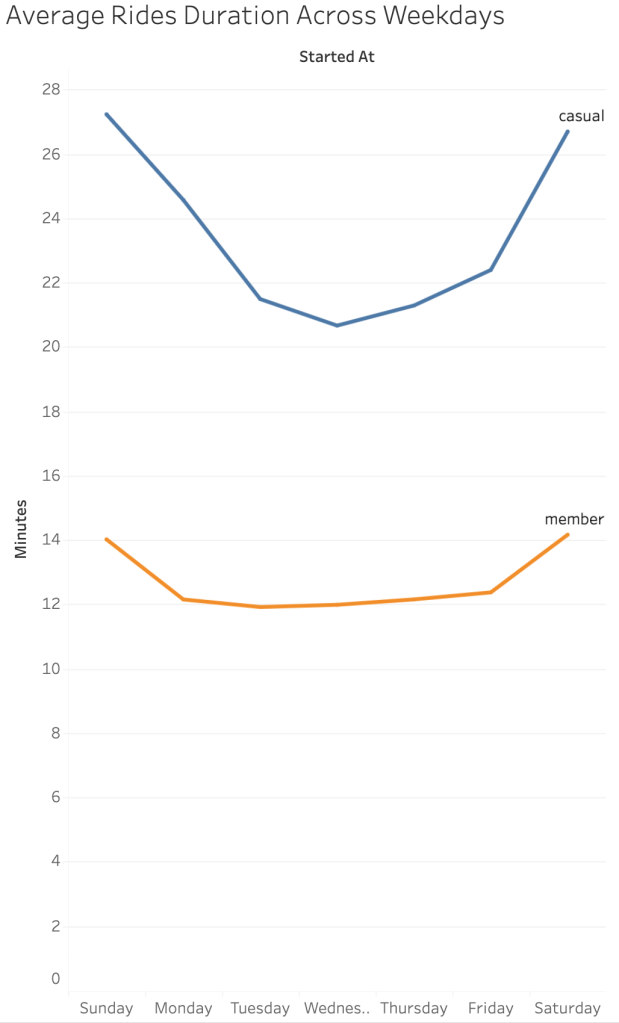
Both types of users take slightly longer rides at weekends. But members are more constant over the week.
Now, I want to see how the number of arrivals and departures changes based on the type of user:

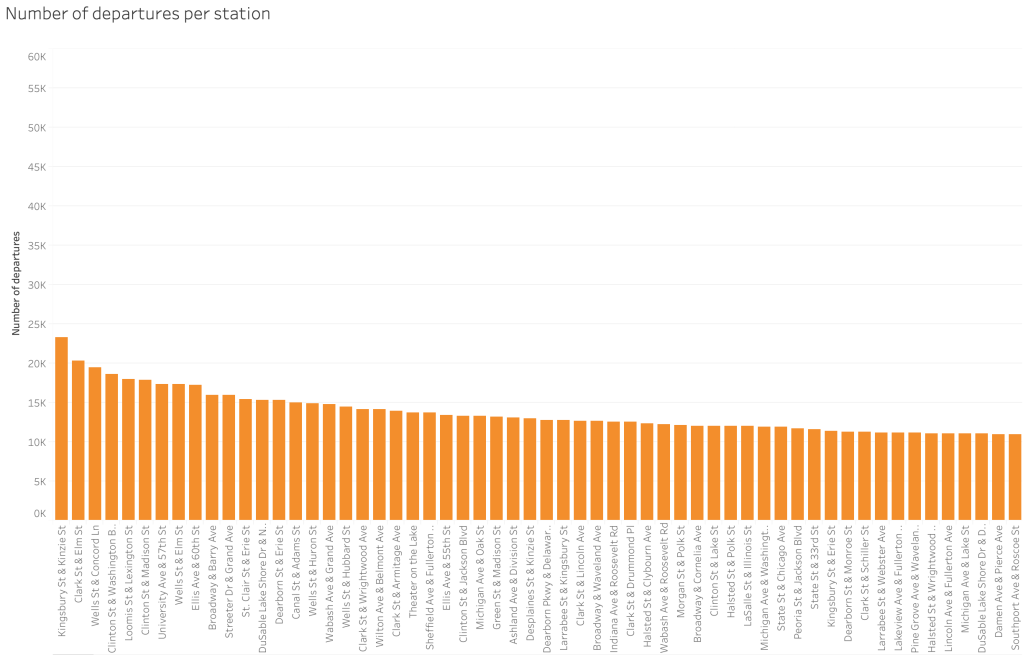
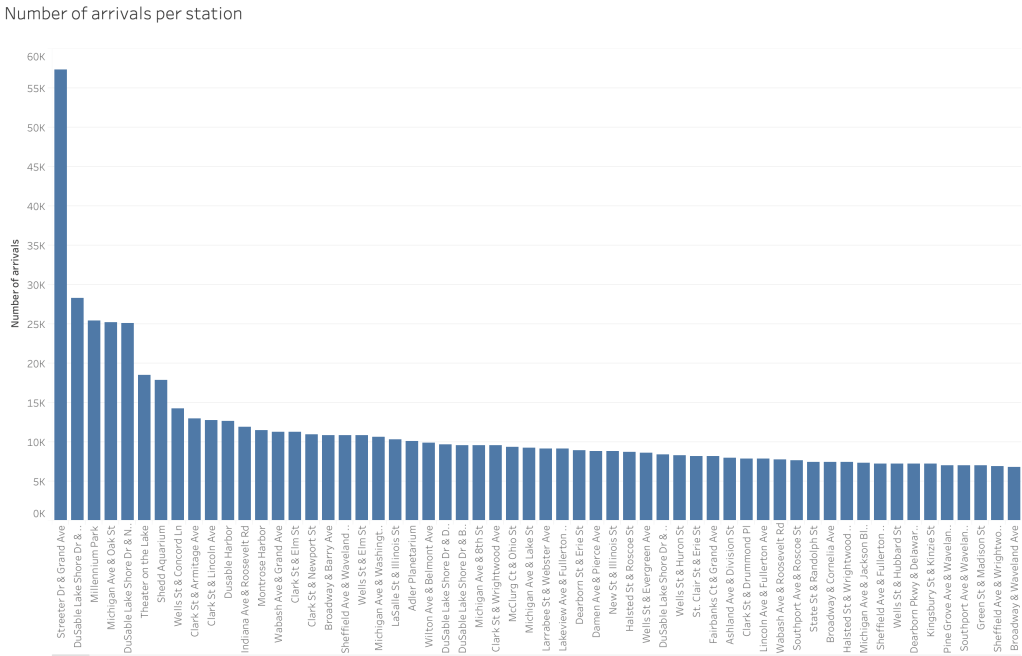
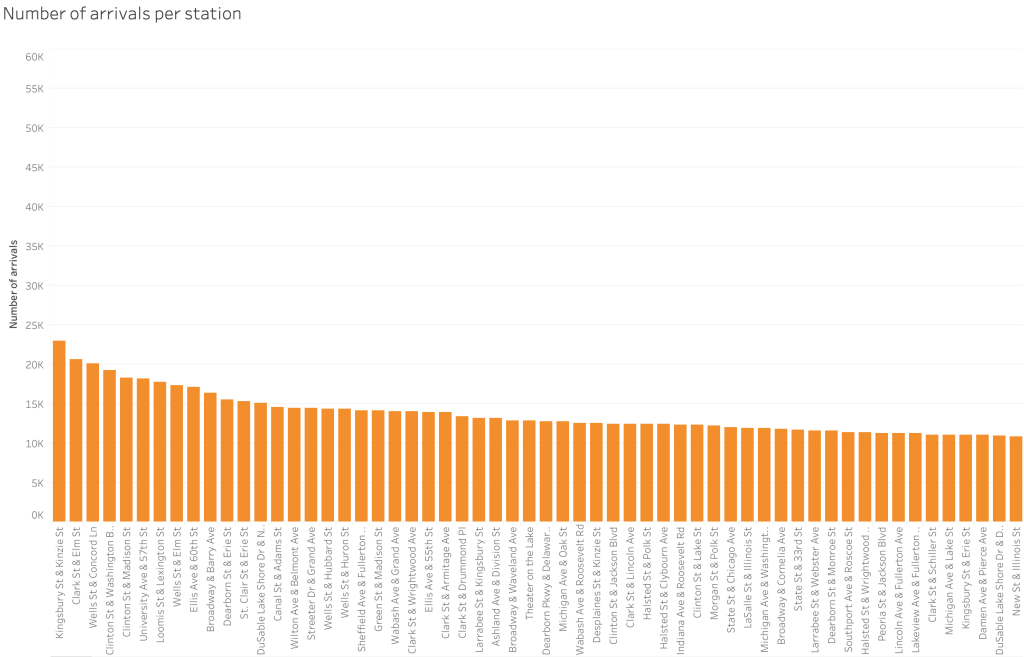
Casual user’s rides are more concentrated on particular stations, while members’ rides are dispersed. This aligns with my hypothesis; since members are using the service for commute, they have to reach a lot of different stations, while casual members might concentrate mainly on the city’s points of interest.
Let’s check out the stations where casual riders are most concentrated:

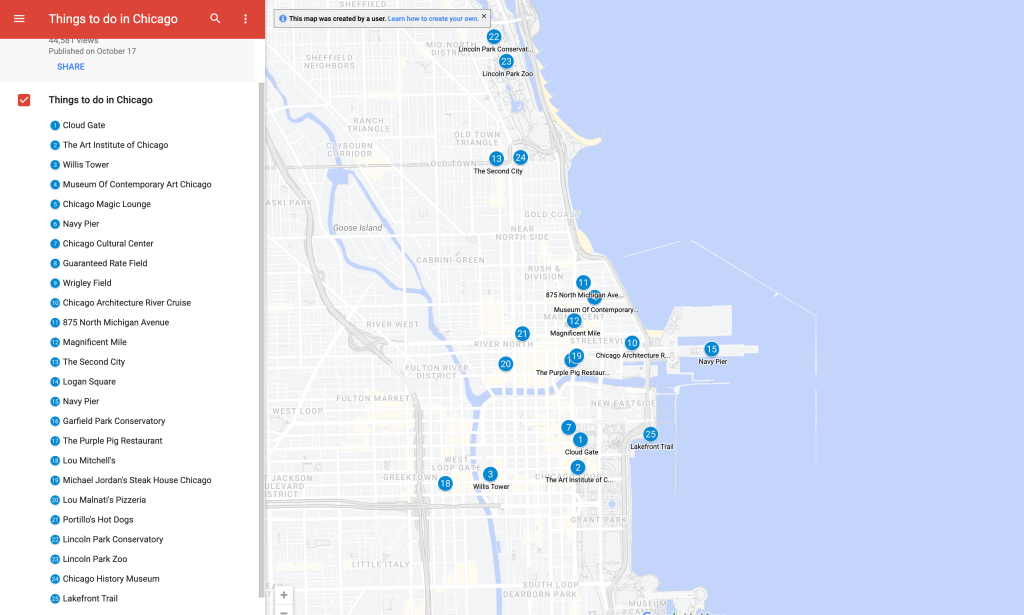
The 8 most reached stations by casual users are close to points of interest given by Google Maps. This demonstrates even more my hypothesis.
Ket insights
- Members tend to take more rides on average.
- Members take more rides on weekdays, while casual users take more on weekends.
- Casual user’s rides are longer on average.
- Casual users’ rides are more focused on particular stations close to points of interest, while members’ rides are dispersed.
Conclusions
The insights extracted from the data seem to confirm my initial hypothesis. To convert casual users to members, we could leverage the membership’s advantages for long rides. Also, we could introduce a membership discount at weekends; this might convince a percentage of casual users to subscribe to the service.
Version:
1.2
Release Date:
8 Dec 2023
Created:
3 Oct 2023
Client:
Cyclistic (imaginary)
Project Duration:
1 week
Place:
Verona, Italy
Language:
English
